Mandelbrot Set and Julia Sets
Both the Mandelbrot Set and Julia Sets are pictorial representations of a simple recurrence formula.
z(n) = z(n - 1) ^ 2 - cwhere values of z and c are complex numbers of the form a + ib and i is the square root of -1.
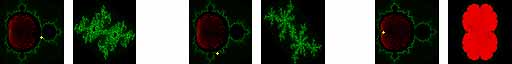
Here both types of image can be seen, Mandelbrot Set to the left and Julia Set to the right, those with Java capable browsers will have to wait for rendering to take place. The sequence of numbers produces by the formula z(n) can either:
- converge on a single number
- diverge to infinity
- continue changing in a chaotic manner
A Julia Set is generated by picking a fixed value for c and taking the value of z(0) from the (x, y) coordinate of the pixel. The Mandelbrot Set uses the fixed value 0 + i0 for z(0) and takes the value of c from the pixel coordinate. In both cases the colouring scheme chosen is the same, first calculate some of the sequence and then assign colour accordingly:
- red - brighter if it took longer to converge
- green - brighter if it took longer to diverge
- black
Many people may be wondering what the red region in the centre of the Mandelbrot Set is, it does not appear on any other pictures I have seen. Normally the convergent (red) part of the image is classed along with the chaotic (black) part and a more complex colour scheme is used for the divergent (green) area.
There is a connection between the two images. If you have the applet running and have not already done so then click on some part of the Mandelbrot Set image, a bright green area is best. A yellow cross marks the point which was selected which corresponds to the c value of the Julia Set. The non-divergent (red, black) region of the Julia Set may come as several separate components surrounded by divergence (green) or may be connected together. All those Julia Sets generated with ac value from a non-divergent region of the Mandelbrot Set will be connected and all those generated from a divergent region will be unconnected. Try it and see.
To examine any parts of the image more closely enter new minimum and maximum values. These control the range of (x, y) coordinates that are shown by the pictures. Click on left or right hand image space as required to start calculation.
For more detail examination the source code is available:
Credits
Thanks to Ron Poet who gave a lecture on the Mandelbrot Set and Julia Sets, some material on this page is based on his notes.
| About this site | Programming | © Matthew Caryl |