Statecharts
Many situations require the simulation of complex behaviour patterns, in my case for use in artificial life programs. State-transition diagrams may seem a suitable modelling tool for this. For those who are unfamiliar with these here is a diagram representing the behaviour of a simple opponent in a computer game. In a state-transition diagram each node represents a single state and each arrow a transition between states caused by an event.
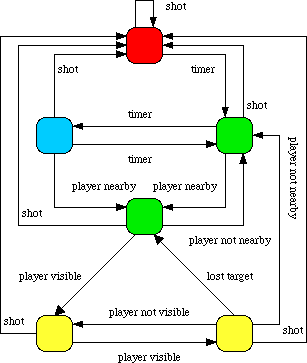
Lets call the player Ann and the computer opponent Bob for wont of better names. Bob has four basic behaviours: stationary blue, random green, hunting yellow, and fleeing red. He starts his life in stationary blue behaviour and waits for a significant event to occur. In this case that means one of a timer going off, Ann approaching, or being shot.
After a certain amount of time waiting in stationary blue a timer will go off and triggering a change in state to random green and Bob will start to move aimlessly about. This state prevents the world going into stasis when Ann is not around. At any one time most of Bob's fellows just stand there but occasionally somebody will move to a new location. Relevant events for this state are similar to that for stationary blue. The only difference is a separate timer setting.
Lets say Ann approaches, Bob is informed she is in the area and moves to another random green state. Behaviour is the same as before but different events become relevant. Now Bob will respond to seeing Ann, her leaving the area, and again being shot. If she leaves then he changes back to the previous state. If Bob spots Ann however he will change to hunting yellow and home in on her, intent on doing her harm or giving her a box of chocolates, whatever the game decrees.
While hunting Bob may loose sight of his target. He will move to his backup behaviour and now hunt the location she was last seen. Hopefully when he arrives she will be visible again and the purposeful hunt can continue. If she does not become visible when he arrives at her last position then he will move back to a random green state.
Being shot is an important event, Bob will respond to it no matter what state he is in. When shot Bob turns coward and changes to a fleeing red behaviour. He will keep running until a reasonable time has passed. If he is shot he will start running again and the timer is reset. Eventually he calms down and will change back to random green movement.
All the details of Bob's behaviour are caught in the state-transition diagram but there are some aspects which are less than desirable. There are a number of duplicate event transitions, including many shoot events. This is a simple behaviour with more complex ones the number of nodes and event transitions will grow and the state-transition diagrams will grow large and unwieldy.
The alternative I propose was first introduced to me in the context of real-time system design. Statecharts add the concepts of hierarchy and concurrency which reduce the above problems. Hierarchy allows super-behaviours to be defined, nodes which can themselves be described by smaller statecharts. Simple behaviours can be viewed on a single page or complex behaviours split easily onto several pages. Concurrency allows multiple behaviours to be applied to a single object. Although not required in the example above it could be used to control another aspect of Bob, say his appearance.
Hierarchy is shown by enclosing state nodes with common features within higher level nodes (or rounded rectangles in this case).
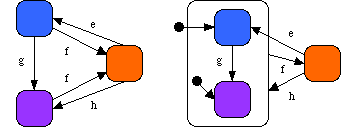
Arrows starting with black circles indicate the starting node for that level of the diagram. So the initial node in this example is blue. If in either the blue or magenta sub-node the response to event f is a transition to orange. From there an e transition takes it back to blue and an h transition takes it back to orange, through one default behaviour arrow.
Concurrency is shown by separating a high level node into two concurrent parts, the dotted line separates concurrent nodes.
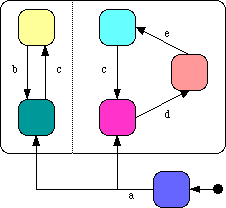
Mauve is the stating node and control stays there until event a. Then it splits into two control flows, one going to aqua, the other to pink. The first thread of control will flip back and forth between aqua and pastel yellow depending on the occurrence of b and c. Independent of this the second control thread rotates between three nodes - pink, rose, and cyan - dependent on the d, e, and c events. Notice that each thread monitors the c event giving some degree of synchronisation between them.
Now back to Bob and his more complex behaviour. Here it is converted into a statechart with the same states and events as before but a few layers of hierarchy added.
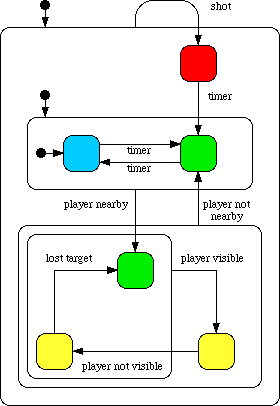
Notice the slightly peculiar action at the top. No matter what state Bob is in, even when it is fleeing red, when he is shot he moves to fleeing red and resets the associated timer. This diagram is more compact and it is much harder to get lost in the diagram whereas it is quite easy with all the event lines in a state-transition diagram.
Design Tools
I am not sure what is the normal procedure for developing behaviour patterns for such things as computer controlled opponents but these statecharts offer an easy option. Given a set of basic behaviour - like those defined for Bob - and some events we can build up complex behaviour quickly. Imagine a design tool with a palette of behaviours. Drop a few of these onto the work area and connect them up with some standard events and you are ready to test. Set up a concurrent thread alongside to control another aspect of his personality. Adding a few levels of hierarchy is easy, just enclose some nodes with the rectangle tool. A few adjustments, drag nodes into a lower level of the hierarchy and the enclosing rectangle expands to fit. It might even be possible to see the behaviour as it was executed and make modifications at the same time.
Behavioural Implementation
As well as offering behavioural descriptions the hierarchical nature of statecharts gives us a clue to an efficient implementation of the same behaviour. Statecharts can be described by a tree in which each parent node has multiple child nodes. A systems current behaviour can be stored by a pointer to the correct node in the tree. The correct action at any particular time does not have to be looked up in a big table it is readily available at the end of the pointer.
Associated with each node are a number of event transitions. When an event occurs a search starts with those event transitions at the current node. If there is not a match then the search moves up to the events in the parent node and so on until the root is reached. If an event transition matching the event is found then it specifies the next current node. Assuming events are stored in a linked list then the tail end of a child's event list could be connected to the front end of its parent's event list. Searching for all appropriate events would be a single linked list search.
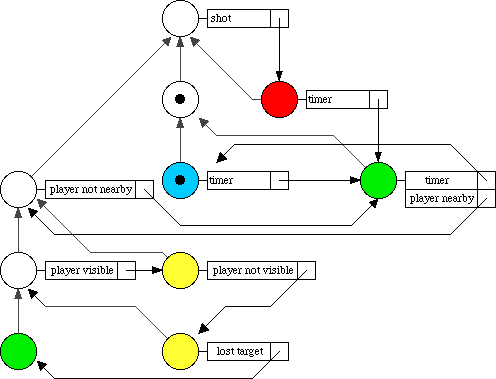
Here is Bob's behaviour again but this time as a tree. In a similar way to statecharts the black circle is used to indicate default behaviour. Black arrows show event transitions and gray arrows show linkage between child and parent node.
Genetic Algorithm
A tree based behavioural implementation is also suitable for my pet artificial intelligence technique - genetic algorithms (see my senior honours project for details). These would work on populations of behaviours, testing to see how well they do their job. Some of the best of the current set are taken and mutated or combined with each other to produce new and hopefully better behaviours. I do not see how combination could be done but mutation is a matter of making small changes to nodes, events, and transitions. Various possibilities are shown here:
- move node up one level
- move node down one level
- move default behaviour to sibling node
- duplicate node
- remove duplicate node
- redirect transition arrow up one level
- redirect transition arrow down one level
- redirect transition arrow to sibling node
- move event up one level
- move event down one level
- move event to sibling node
- duplicate event
- remove duplicate event
As far as I know this technique is untried. In comparison with other method the representation of behaviour is easy to understand and so it would be possible to graphically follow the development individuals from generation to generation.
Credits
Thanks to Jim Burns at the University of Glasgow for first introducing me to statecharts.
Higraph and statecharts are described in "On Visual Formalisms" by David Harel printed in "Communications of the ACM", May 1988, Volume 31, Number 5. Some of the examples given in this paper are used here.
| About this site | Artificial Life | © Matthew Caryl |